The Basics of Sea Level Rise Science and Vulnerabilities in Unincorporated Ventura County
Why are Sea Levels Rising, and By How Much?
As temperatures increase globally, sea levels are subsequently rising as a result of a few major factors. First, as ocean temperatures warm, the water in the ocean expands and occupies more space, resulting in higher sea levels. Second, increased temperatures lead mountain glaciers and ice caps to melt at faster rates, increasing the water in the ocean. Extreme ice loss from the Greenland and Antarctic ice sheets is increasing the amount of water in the ocean. If all the ice on earth was to melt, sea levels would rise by approximately 220 feet above present-day levels! Ice melt is predicted to soon become the primary contributor to global sea-level rise. In California, ice loss from Antarctica causes higher sea-level rise than the global average. For example, if the loss of Antarctic ice were to cause global sea level to rise by 1 foot, the associated sea-level rise in California would be about 1.25 feet (OPC, 2018).
Scientific understanding of sea level rise is constantly evolving and advancing rapidly as understanding grows of the natural climate cycles and human impacts. The exact rate and magnitude of sea level rise over the next century is uncertain, though it is steadily increasing. Sea level rise is a slow-moving threat, but this is not a reason for inaction. The first step in effective sea level rise planning is to understand the amount the sea will rise and where impacts are likely to occur.
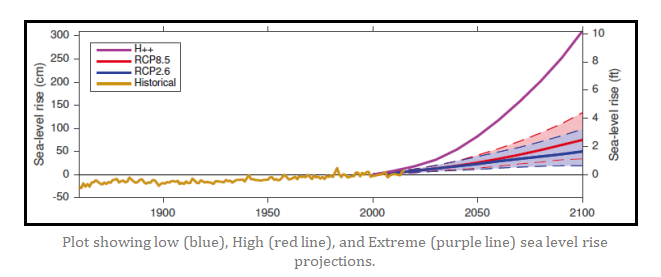
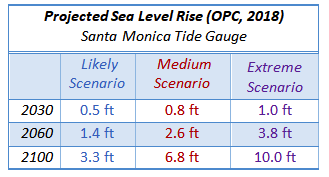
By the year 2100, the sea level is expected to rise between 3 feet to over 10 feet. The range reflects variations in future climate change emissions, ocean warming, and ice sheet loss (Parris et al. 2012). In the US, A 5-foot increase in water levels caused by sea level rise is estimated to affect 499,822 people, 644,143 acres, 209,737 homes, and $105.2 billion of property value in coastal areas across the United States (Climate Central, 2014). Sea level rise will not have the same effect everywhere around the world. Local sea level rise is measured using data collected by tide gauges. The Santa Monica tide gauge shows an average historical rate of sea level rise of about 1.5 mm per year, an average of about a half an inch per decade. Given the existing GHG emissions, the long-term time scale, and feedback mechanisms evaluated in the latest science, the rate of sea level rise is projected to accelerate in the future, resulting in an increasingly upward curve (see figure below).
The numbers in the table on the right are color-coded to represent the solid lines in the chart above, they show the amounts of sea level rise that are projected to occur along the lines at specific years. For example, the purple line shows that by the year 2100, there could be over 10 feet of sea level rise. When sea level rise combines with coastal storms, the flooding becomes even more severe, as described further below.
Sea Level Rise Vulnerability Assessment Report: How will Ventura County be Impacted?
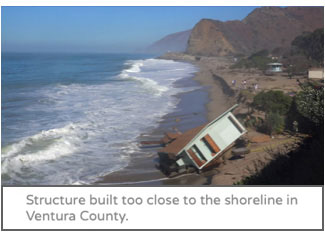
Locally, early impacts of rising seas are already being experienced, including coastal flooding during storms, periodic tidal flooding, and increased coastal erosion. Sea level rise will lead to higher tides, more extensive coastal flooding. Rising sea levels alone will not be the primary cause of damage to County resources and infrastructure. These impacts will be caused by coastal erosion during large wave events.
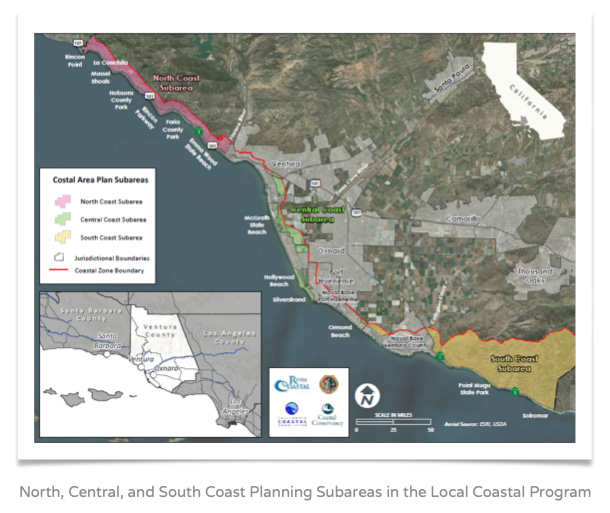
Ventura County is working in collaboration with community stakeholders to identify the impacts sea level rise will have on the County. The Ventura County Planning Division, through the VC Resilient Coastal Adaptation Project, is planning for sea level rise in the unincorporated areas which includes the 29 miles of coastline shown in the map below. Sea level rise will not have the same effect everywhere. For example, in unincorporated Ventura County, the mountainous coastal areas on the North and South Coast (red and yellow-colored areas on the map below) fewer acres of land will be affected by sea level rise compared to the low lying, relatively flat Central Coast (green-colored areas on the map) on the Oxnard Plain.
The first step in the VC Resilient Project was development of a Vulnerability Assessment that was completed in 2018. This assessment is an informational document that highlights potential impacts using three different sea level rise scenarios across the entire unincorporated County coastline that extend out to year 2100. The report also estimated the combined effects of sea level rise with powerful waves from coastal storms, extreme rain events that could overtop the banks of the Santa Clara River, and erosion of shoreline beaches and bluffs. The best available science was used to complete the report.
According to the Vulnerability Assessment, only 8 inches of sea level rise in the unincorporated areas of the County would expose 1,580 acres of prime agricultural land, 1,516 structures, and over 33 miles of roadways to coastal hazards. With about 5 feet of sea level rise, these estimates increase to 2,085 acres of prime agricultural land, 2,230 structures, and 54 miles of roadways. The economic impacts could be severe, with over $2.3 billion in property at risk due to coastal flooding and erosion during a large coastal storm that combines with 5 feet of sea level rise. Over $800 million in property values could be exposed to monthly tidal inundation. Also, the report estimated that coastal flooding and tidal inundation could result in around $30 to $58 million in economic loss due to decreased agricultural productivity.
Sea Level Rise Vulnerability Assessment
Watch a brief video which provides an overview of sea level rise science and the Vulnerability Assessment results in English and Spanish.
Click on the links below to read the Vulnerability Assessment. Due to the large file size, the assessment has been broken into segments.
- VC Resilient Vulnerability Assessment – Report Body
- VC Resilient Vulnerability Assessment – Appendix A – Sector Profile Maps – Part 1
- VC Resilient Vulnerability Assessment – Appendix A – Sector Profile Maps – Part 2
- VC Resilient Vulnerability Assessment – Appendix B – Vulnerability Results Table
- VC Resilient Vulnerability Assessment – Appendix C – Social Vulnerability
- VC Resilient Vulnerability Assessment – Appendix D – Natural Resources Maps
The Vulnerability Assessment is a starting point for a common understanding of the risks, but it does not provide solutions. There are few easy solutions and most require additional coordination and dialogue with members of the public, including private landowners, with surrounding cities, and with other state and federal resource agencies. This first step is a comprehensive look at the resources that are exposed and an evaluation of how sensitive these assets are to sea level rise.
Click here to learn about Sea Level Rise Adaptation and to review the Adaptation Report.

